Anatomy of an Edge

Every cell in the Edge Map is the output of a complete force-balance solve. Tap one and the detail card opens with the delta, per-sail attribution, and whole-boat outcome. What you see depends on your tier — but the physics underneath is always the same.

Explore Your Edge Start with one cell →
72 Cells

One Wind Condition. One Sail Combination. One Answer.

A cell is a single intersection in the wind matrix: one true wind angle, one true wind speed, one sail combination evaluated against the ORC polar. The force-balance solver runs for that specific condition, converges on equilibrium, and produces a speed delta — the difference between what this sail combination delivers and what the rated plan delivers at the same point.

72 cells. One full force-balance solve per cell. A 907-formula engine behind every answer.

That delta is encoded as a color on the Edge Map surface. Green means faster. Red means slower. Tap the cell and the detail card opens. What’s inside that card depends on the tier you’re subscribed to — but the computation behind it is identical at every level.

Edge Map grid fragment with one cell selected at TWA 75 degrees, TWS 10 knots, showing Code Zero plus Main sail producing a speed delta of plus 0.41 knots via force-balance solve

Subscriber Tier

The Decision Layer

The subscriber tier gives you what you need to make a call. Speed delta. Boat speed. Heel angle. VMG. The selected sail combination. The wind condition. This is the self-sufficient answer layer — enough to decide whether this sail is faster, and by how much.

Most racers live here. You see the answer, you see the margin, you see which sail wins. If the delta is green and the margin is meaningful, you have your answer. No force diagrams, no coefficient tables. Just the result, with enough context to trust it.


Professional Tier

The Diagnosis Layer

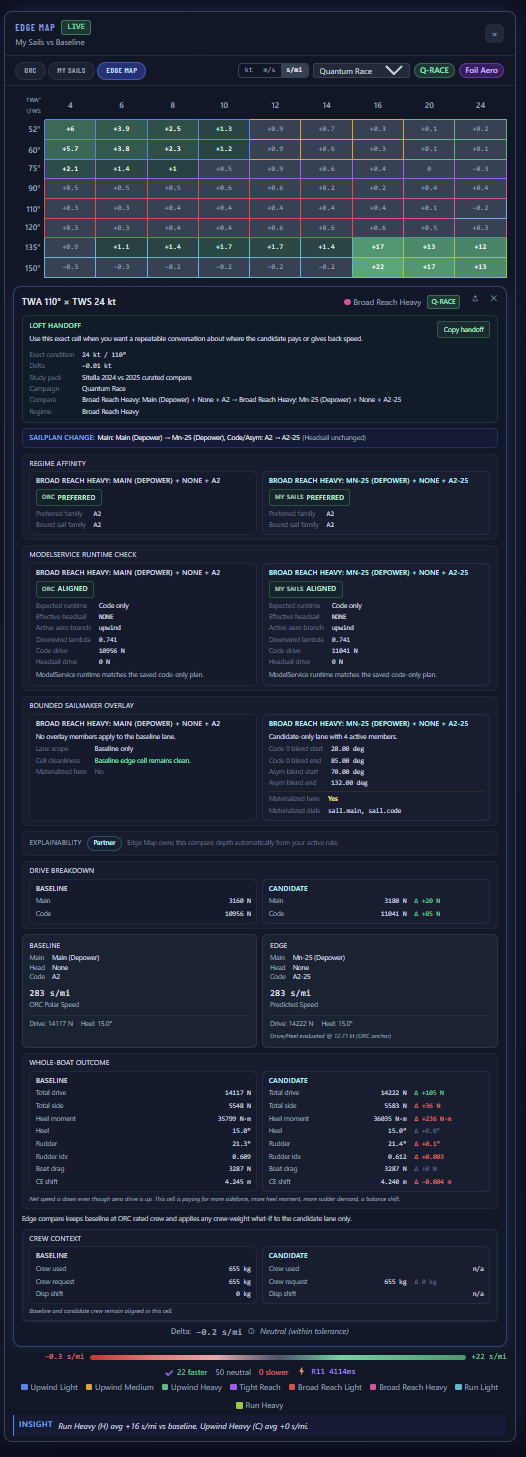
The professional tier opens the engine room. Per-sail force attribution — how much drive and how much side force each sail contributes. Whole-boat outcome — what the gain paid for in heel, rudder, drag, and balance shift. Center of effort geometry — where the resultant force acts on the rig and how it relates to the center of lateral resistance. Effective areas. Heel equilibrium breakdown. Depower state for every sail. Confidence indicators. Clamp attribution. Wave-lane status when approved wave input is active or bounded. RM supplement and crew mode when crew weight what-if is active.

This is where the delta stops being a color and starts being a diagnosis. A sailmaker can see which force component is underperforming. A naval architect can see where the CE-CLR balance shifts. A coach can trace a speed loss to a specific sail’s contribution at a specific angle. And when aero drive goes up but speed still falls, the whole-boat outcome tells you why.

Same cell, same computation. Just more of it visible.

Professional-tier Edge Map detail card showing handoff context, regime affinity, runtime check, bounded sailmaker overlay, drive breakdown, whole-boat outcome, crew context, and confidence indicators in seconds per mile

Engineering Tier

The Full Computation

The engineering-grade tier exposes the complete solver state. Every intermediate variable, every convergence parameter, every constraint evaluation. This tier is available under NDA to qualified partners, with protected tuning and server-side implementation kept out of the browser.

The physics doesn’t change between tiers. The depth does.


Integrity

When the Model Tells You to Look Closer

Not every cell is green or red. Some are amber. Amber means the model produced a result, but something about the solve deserves attention — a physical constraint was active, a force balance was near its convergence boundary, or the operating point sits outside the sail’s effective range.

The detail card tells you exactly what triggered the flag. Clamp attribution shows which constraint limited the result. That can include a physical fence, a bounded wave lane because approved input is missing, or a solve that deserves extra caution. Unstable cells — where the solver could not converge to a reliable equilibrium — are suppressed entirely rather than displayed with false confidence.

That’s not a limitation. That’s integrity.

See how the computation works →

See the three tiers →

See It for Yourself

Upload your ORC certificate. Tap a cell. See what’s behind the number.

Explore Your Edge The physics behind it →