Every sail. Every angle. Every delta — in one map.
Your ORC certificate is the baseline. The SailEdge™ Edge Map measures every sail
against it — at every wind speed and angle. Green where you gain.
Red where you don’t. The exact delta in knots, meters per second, or seconds per mile,
with Each Edge Map runs ~855,000 calculations — a full VPP aero and hydro solve at every point in the wind envelope — and one-tap explainability from per-sail attribution to whole-boat outcome.
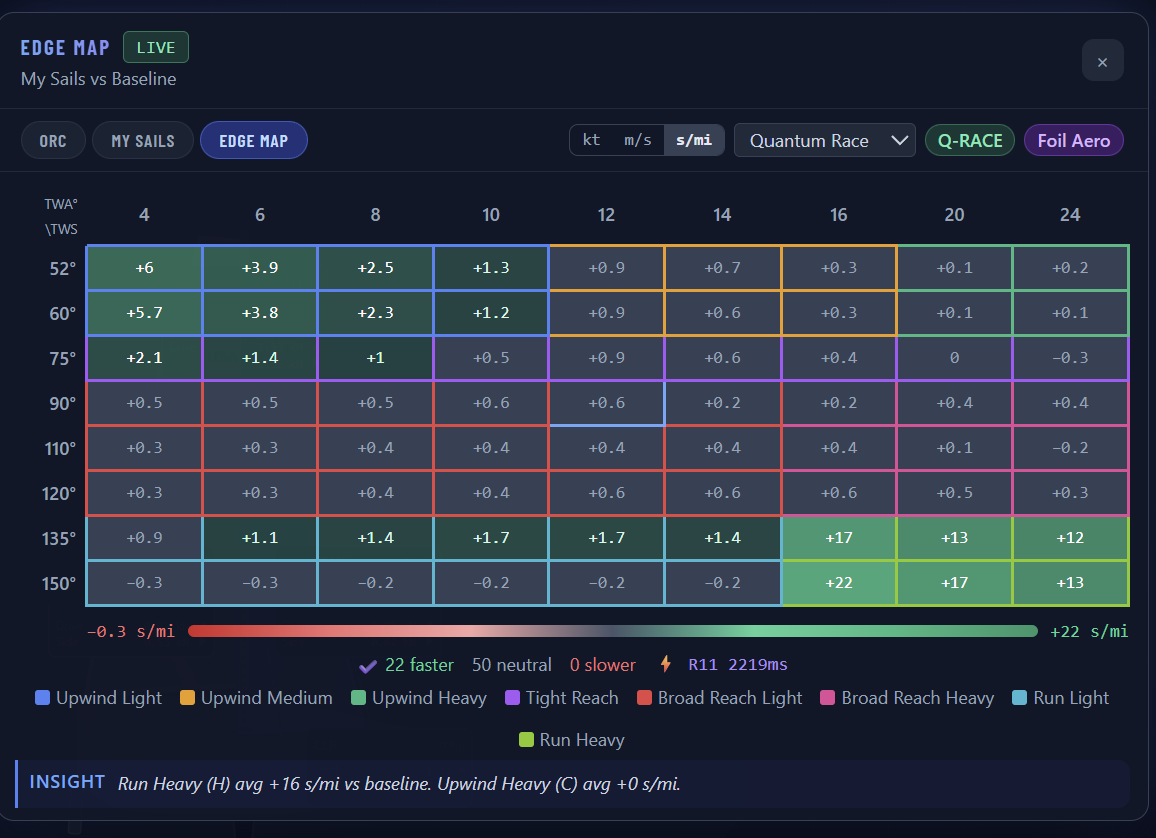
The Edge Map is a performance delta grid. Your ORC certificate sets the baseline. Each cell shows how a specific sail performs at a specific angle and wind speed — relative to that baseline. Green is faster. Red is slower. The number is the margin.
Sitella — Cape 31, Key West class winner. Real boat, real certificate, real Edge Map.
Sitella (Cape 31) — Main vs Mn-25 in seconds per mile. 22 faster, 50 neutral, 0 slower. Regime color coding and INSIGHT bar.
Every cell in this grid is the output of a complete force-balance solve — drive,
side force, heel equilibrium, a DSH-backed calm-water backbone with bounded follow-on
lanes, resistance, depower, and bounded wave-lane status when it matters —
iterated across your ORC polar. The color is the headline. The physics behind it is
one tap away.
Product Architecture
Three tabs. One baseline. Every question answered.
ORCYour certified baseline. Every speed, every angle.
My SailsWhat your sails actually do — measured against it.
Edge MapThe gap. Quantified across the full wind range.
ORC
Your certified polar — the baseline the racing world trusts.
Every speed at every angle, straight from the certificate.
The ruler everything else is measured against.
My Sails
What your actual inventory does at each wind speed and angle.
Green where your sails beat the baseline. Red where they fall short.
The delta in knots.
Edge Map
The comparison layer. Maps the gap across the entire wind range,
groups cells into regimes, and surfaces the headline:
“59 cells faster, 20 neutral, 9 slower.”
Tap any cell to drill in.
One trusted baseline. Your real sails. The full picture — measured, not guessed.
At a Glance
What the Edge Map shows you.
Full Wind Matrix
Performance across every wind speed and angle your ORC polar defines.
Not a single number — the complete picture, one cell at a time.
Per-Sail Attribution
Tap a cell. See which sail drives the delta — main, headsail,
or code sail — with drive force and heel moment broken down
individually, then read the whole-boat outcome beside it.
Confidence Indicators
When the physics hit a boundary — hull speed cap, underpowered
baseline, high rudder demand, or missing approved wave input — the cell
tells you. Amber means boundary-limited. Grey means the model suppressed a meaningless result.
Sanity Checks
Invalid sail combinations are flagged, not hidden. If a reaching kite
produces drag instead of drive at that angle, the model says so rather
than painting a misleading green cell.
Three ways to read your edge.
Every sailor reads performance differently. The Edge Map lets you toggle between three
result formats — knots, meters per second, and seconds per mile — with one tap.
Knots is the default. Fractional knots show the raw speed delta: +0.43 kt
means you’re nearly half a knot faster at that condition. Intuitive for anyone who reads
a knotmeter.
Meters per second is the SI standard — useful when working with
international rating offices or comparing against ORC VPP output directly.
Seconds per mile flips the question. Instead of “how much faster am
I?” it answers “how many seconds do I save per mile sailed?” At Farr
Designs’ recommendation, we added this view because it maps directly to what matters
on a racecourse: time on the water. A +26 s/mi delta at TWA 52° in 10 kt means that
sail change saves you 26 seconds every mile you sail at that angle and breeze. Over a
5-mile windward leg, that’s over two minutes.
All three formats use the same underlying physics. The unit toggle changes presentation,
not computation. Cell intelligence, confidence indicators, and sail plan attribution all
work the same regardless of which unit you choose.
The delta is the headline. Everything behind it — per-sail attribution, whole-boat
outcome, and confidence state — is one tap away.
Under the Hood →
Built for Today’s Sails
Designed for the sails you actually buy.
Squaretop mains, membrane headsails, Code sails, asymmetric kites —
the aero model recognizes modern planforms and credits them accordingly.
A squaretop main gets different treatment than a pinhead. A membrane genoa
isn’t a Dacron genoa. Sailmaker-provided shape and material metadata
flows into the model when available, and conservative defaults apply when
it doesn’t.
Go Deeper
Pick your depth.
Under the Hood
Tap any cell and see everything behind the number. Per-sail drive
breakdown, confidence indicators, sanity checks, and the aero model
that produces them.
Isolate one sail decision. Same boat, same wind range, one variable
changed. Pick from pre-loaded studies or build your own — upwind
headsails, Code Zero evaluation, kite selection, and more.
Drive, side force, heel equilibrium, resistance, depower. Every cell
is a complete force-balance solve run across your ORC polar. See what
gets computed and why.
Tap any cell and unfold it — layer by layer. Headline delta,
per-sail force decomposition, whole-boat outcome, confidence bounds,
and the model state that produced the number.
Is a new Code Zero worth it? What happens with 7 crew instead of 8?
Load a sail into a what-if slot or change the crew weight — run the model,
see which cells change and by how much.
Cost Per Tenth
Three numbers change the conversation: cells improved, average delta
gain, cost per tenth of a knot. A $12K purchase that lifts 40 cells
by 0.3 kt is a different proposition from one that lifts 10 cells by 0.1.
Two Sails, One Budget
When the budget covers one sail, not two, the Edge Map shows which
purchase closes more gaps across the wind range. Same baseline, same
boat — apples to apples.
Quiver-Level View
Zoom out and the Edge Map becomes a full inventory assessment. Where
you’re covered, where you’re exposed, where the next
upgrade delivers the most value.
Every sail decision is a trade-off. The Edge Map makes it visible.
Crew weight is now part of the same what-if workflow — one checkbox, no Expert Mode needed.
Share your findings — screenshot, summary, and a live link —
so your sailmaker sees exactly what you see. When your loft is a
SailEdge partner, the results reflect their calibrated aero models —
not just generic coefficients.
Want to rank your entire wardrobe?
The Edge Map compares two configurations. The Optimal Map ranks every sail across
every condition — with crossover zones that tell you exactly when to switch.