SailEdge™ by SailrScience Layer 1 is designed for sailors who have an ORC certificate and normal sail measurements (luff/foot/leech/LP), but do not have a modern design export or cut sheet. It produces Edge Map decisions that match common sense: where a sail helps, and why.
Layer 1 focuses on robust, explainable results without requiring loft files.
It is intentionally conservative: it rewards better sails where they should win,
and avoids claiming gains that the boat cannot translate into speed due to stability or control limits.
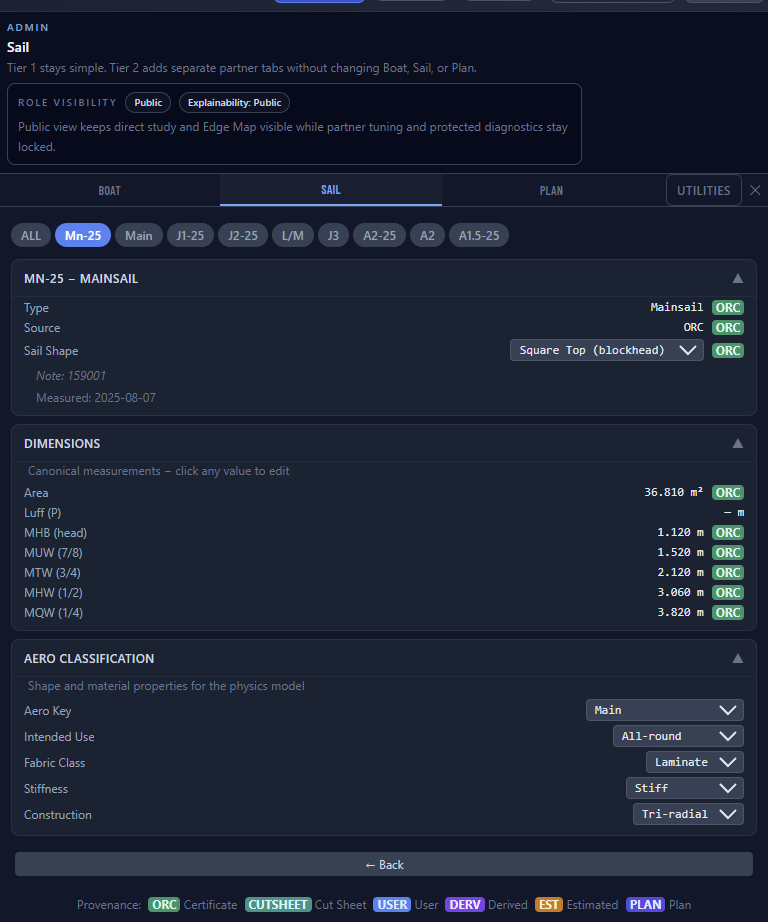
Mn-25 mainsail — ORC certificate dimensions and Aero Classification with provenance badges. Every measurement traced back to its source.What inputs Layer 1 needs
Input
Where it comes from
Why it matters
ORC polar grid (TWS × TWA)
Certificate
Certified baseline and grid definition for the Edge Map
Rig geometry (I, J, P, E)
Certificate
Reference scale for planform proxies and CE/CLR placement
Sail type (Main/Genoa/Jib/Code/Asym)
UI selection
Selects the correct regime behavior and coefficient family
Basic sail measurements
UI input
Builds an effective planform and centroid/CE proxy
Material / build class
UI input
Bounded modifiers for “light vs heavy” sail behavior (durability tradeoffs)
Sail Geometry Without a Cut Sheet
Yes — you can define new Code sails from basic measurements.
Many sailors can’t access (or don’t want to manage) a full cut sheet.
Layer 1 still supports rational “new sail” comparisons by building a conservative effective planform
from the measurements you can easily provide.
Centroid proxy (triangle)
c = (ptack + phead + pclew) / 3
Used for sails that are well-described by the three corners (pinhead mains, many headsails).
The goal is stable, explainable CE behavior rather than chasing tiny design nuances.
Planform proxy (stacked sections)
Represent the sail as a small set of spanwise stations (trapezoid stack), then area-weight their centroids.
This allows Layer 1 to approximate the area distribution of squaretops and deeper Code shapes even without a full loft file.
Higher-level layers refine this with richer station data and foil-aware modifiers.
Physical Boundaries
Stability and control limits prevent “fantasy greens”.
Layer 1 couples sail force to heel and helm. If the sail produces force the boat can’t carry,
the model reduces effective power (depower transforms) rather than claiming free speed.
This is one of the core reasons the Edge Map stays realistic for average sailors.
Hull-speed fence (displacement limit)
Vhull = 1.34 × √LWL
Layer 1 clamps predictions near hull-speed rather than extrapolating into planing performance the hull cannot reach.
For planing-capable hulls, the fence relaxes — but Layer 1 remains conservative by
design. Higher-fidelity planing behavior is available in Layer 2 with cut-sheet inputs.
Want deeper technical detail on depower, CE/CLR coupling, and diagnostic flags? Jump to
Layer 2.
Edge Map Guidance
How Layer 1 helps you buy the right sail
The Edge Map answers three practical questions:
Where does the new sail win? (green cells by angle and wind speed)
Where does it not? (no green where drag, stability, or control costs dominate)
What changed? (click-through shows baseline vs test, including the configured sail names and key drivers)
Example: You’re debating a Code 0 vs a smaller jib for light-air reaching.
Layer 1 takes both sail measurements, runs the aero model across the full grid, and shows
you green clusters in the reaching light-air cells — or not. No cut sheets required.
The answer is in the cells.